Explaining Hiring Metrics: A 2026 Guide for HR Teams
Explaining Hiring Metrics: A 2026 Guide for HR Teams

Hiring metrics are quantifiable measurements that enable HR professionals and hiring managers to evaluate recruitment efficiency, quality, and candidate experience across every stage of the hiring funnel. Explaining hiring metrics clearly is the foundation of any data-driven talent acquisition strategy, and the gap between teams that track them well and those that don’t shows up directly in hiring speed, cost, and retention. Reports from SHRM, LinkedIn Talent Solutions, and recruitment analytics platforms consistently show that organizations using structured metric frameworks fill roles faster and at lower cost. This guide covers the core metrics, current 2026 benchmarks, and the practical steps to turn data into better hiring decisions.
What are the key hiring metrics and how are they defined?
Hiring metrics, also called recruitment key performance indicators (KPIs), fall into two broad categories: activity metrics and outcome metrics. Understanding both is the starting point for any serious recruitment analytics practice.
The six metrics every hiring team must define:
- Time-to-fill: The number of calendar days from when a job requisition opens to when a candidate accepts an offer. This measures overall process speed and resource planning efficiency.
- Time-to-hire: The number of days from when a candidate enters your pipeline to when they accept. Unlike time-to-fill, this measures the candidate’s experience of your process speed.
- Cost-per-hire: Total recruiting spend (internal labor, advertising, agency fees, technology, onboarding) divided by the number of hires in a given period.
- Offer acceptance rate: The percentage of extended offers that candidates accept. Formula: (offers accepted / offers extended) × 100.
- Quality of hire: A composite score measuring new hire performance ratings, retention at 90 days and one year, and hiring manager satisfaction. It is the most strategically valuable metric and the hardest to calculate.
- Pipeline conversion ratios: Applicant-to-interview ratio and interview-to-offer ratio. These throughput metrics reveal where candidates drop out or get screened out.
The distinction between time-to-fill and time-to-hire matters more than most teams realize. A long time-to-fill with a short time-to-hire tells you the sourcing pipeline is slow. A short time-to-fill with a long time-to-hire points to process friction after candidates apply. Reading them together gives you a diagnosis, not just a number.
Pro Tip: Define each metric in writing and share the definitions with every member of your hiring team before you start tracking. Without shared vocabulary, your data will be inconsistent from the start.
Quality of hire deserves special attention because only 20% of organizations actually measure it despite 89% agreeing it is the most important metric. That gap exists because quality of hire requires connecting recruiting data to post-hire performance data, which demands coordination between HR, hiring managers, and sometimes finance. The effort is worth it. Quality of hire is the metric that connects your recruiting function directly to business outcomes.
What are the current 2026 benchmarks for hiring metrics?
Benchmarks give your numbers context. Without them, a 50-day time-to-fill could look acceptable when it is actually a warning sign, or a $5,000 cost-per-hire could seem alarming when it is below your industry average.
| Metric | Benchmark | Warning Sign |
|---|---|---|
| Time-to-fill | 44 days (U.S. average) | Over 60 days for non-executive roles |
| Cost-per-hire | $4,700 (non-executive) | Executive roles average 7x higher |
| Offer acceptance rate | 80% or above | Below 75% signals compensation or process issues |
| Interview-to-offer ratio | 3:1 | Above 4:1 indicates too many borderline candidates |
| Interviews per hire | 20 (2025 SHRM data) | Varies significantly by role seniority |
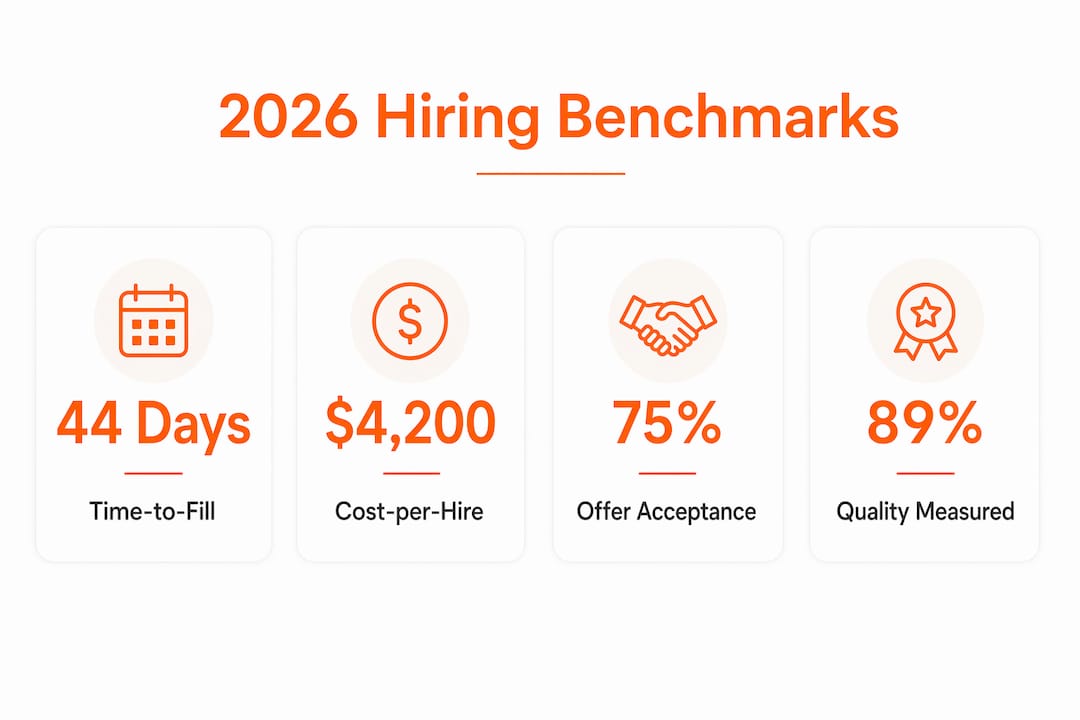
The 44-day average time-to-fill represents a 24% increase since 2021, meaning the market is getting harder to move through quickly, not easier. That trend should recalibrate your internal expectations and your hiring manager communications. Telling a business unit that 50 days is “slow” when the market average is 44 days creates unnecessary friction.
The average cost-per-hire of $4,700 covers non-executive roles and includes both internal and external costs. Executive hires cost approximately seven times more when you factor in search firm fees, extended interview cycles, and onboarding investment. Tracking cost-per-hire by role level and department gives you far more useful data than a single company-wide average.
Metrics should serve as reference points, not rigid targets. Market conditions, role specificity, and organizational context all determine what a number actually means for your team.
Pro Tip: Build a benchmark comparison table specific to your industry and role types. Generic national averages are a starting point, but your real baseline is your own historical data from the past 12 to 24 months.
Offer acceptance rates below 75% signal a problem that costs real time and money. Each rejected offer delays your pipeline by two to four weeks on average, which compounds across multiple open roles. When acceptance rates drop, the root cause is almost always one of three things: compensation misalignment, a poor candidate experience during the process, or a mismatch between the role as described and the role as presented in interviews.
How to interpret hiring metrics for better recruitment decisions
Interpreting metrics correctly means reading them in combination, not in isolation. A single number rarely tells you what to fix. A pattern across multiple metrics tells you exactly where to look.

Consider this scenario: your time-to-fill is rising, but your interview-to-offer ratio is steady at 3:1 and your offer acceptance rate is above 80%. That combination points directly to a sourcing bottleneck. You are converting candidates well once they are in the pipeline, but not enough qualified candidates are entering it. The fix is sourcing strategy, not interview process or compensation.
Now consider the opposite: time-to-fill is stable, but your offer acceptance rate has dropped to 68% over the past quarter. That pattern points to a compensation or candidate experience problem. Your pipeline is full and your screening is working, but something is breaking down at the offer stage. Reviewing your compensation benchmarks and your candidate feedback scores will tell you which.
The most common trap HR teams fall into is tracking activity metrics like resumes reviewed, calls made, or job posts published instead of outcome metrics like quality of hire and first-year retention. Activity metrics are easy to collect and easy to report, but they do not correlate with hiring success. A recruiter who reviews 500 resumes and makes two strong hires outperforms one who reviews 200 resumes and makes zero. Volume is not performance.
Pro Tip: Focus your dashboard on four core metrics first: time-to-fill, cost-per-hire, offer acceptance rate, and quality of hire. Add pipeline conversion ratios once you have a reliable baseline on those four. Expanding too fast creates metrics sprawl and reporting overload.
Outcome metrics like quality of hire and first-year attrition connect recruiting directly to business results, but they require data maturity to track well. If your organization does not yet have a structured performance review process or a 90-day check-in protocol, start there before trying to calculate quality of hire. The metric is only as good as the data feeding it.
How to track hiring metrics effectively using tools and best practices
Building a reliable recruitment analytics practice follows a clear sequence. Start with the right metrics, then build the infrastructure to collect them consistently.
- Define your four core metrics before selecting any tool. Time-to-fill, cost-per-hire, offer acceptance rate, and quality of hire are the four core signal metrics that provide reliable baseline insight for any organization.
- Implement or audit your applicant tracking system (ATS). Platforms like Greenhouse, Lever, and Workday automatically capture time-stamps, source data, and pipeline stage transitions. Manual tracking in spreadsheets introduces errors and delays that make your data unreliable.
- Set review cadences by metric type. Review pipeline metrics (applicant-to-interview ratio, interview-to-offer ratio) weekly. Review outcome and cost metrics monthly or quarterly. Reviewing cost-per-hire weekly adds noise without insight.
- Build custom benchmarks from your own historical data. Your 12-month rolling average for time-to-fill by role type is more actionable than any national benchmark. Use industry data as context, not as your primary target.
- Standardize definitions across your hiring team. Consistent metric definitions are critical to credible analytics. If one recruiter starts the time-to-hire clock at application and another starts it at first contact, your data is not comparable. Document your definitions and train every team member on them.
Recruitment ROI is the metric that connects all of this to the business. The formula is straightforward: (value delivered by new hires minus total recruitment cost) divided by total recruitment cost. Calculating recruitment ROI requires finance partnership, but it is the clearest way to demonstrate the strategic value of your recruiting function to leadership.
Candidate satisfaction scores, often measured through a Candidate Net Promoter Score (cNPS), are worth adding once your core metrics are stable. Candidate experience correlates directly with offer acceptance rates and referral pipeline growth. A poor experience does not just cost you one candidate. It costs you the candidates they would have referred.
Common mistakes when using hiring metrics and how to avoid them
The most damaging mistake in recruitment analytics is tracking metrics that feel productive but do not connect to outcomes. Here are the patterns to watch for and correct:
- Metric overload: Tracking 15 or more KPIs simultaneously creates reporting burden without clarity. Focus on the metrics tied to your current hiring goals, then expand.
- Ignoring context: A 60-day time-to-fill for a senior engineering role in a competitive market may be excellent. The same number for a junior sales role is a red flag. Always interpret numbers against role type, seniority, and market conditions.
- Inconsistent definitions: If your ATS calculates time-to-hire differently than your manual tracking sheet, you will make decisions based on bad data. Audit your definitions quarterly.
- Chasing vanity metrics: The number of LinkedIn followers your company page has, or the volume of applications received, tells you almost nothing about hiring quality. These numbers feel good to report but do not drive decisions.
- Neglecting post-hire data: Hiring metrics that ignore what happens after the offer letter are incomplete. First-year performance ratings and 90-day retention rates are the proof points that validate or challenge your pre-hire screening decisions.
Pro Tip: Align every metric on your dashboard to a specific hiring decision or business question. If you cannot name the decision a metric informs, remove it from your reporting.
The best practices for hiring metrics also include training hiring managers to read and act on data, not just recruiters. When hiring managers understand what a 4:1 interview-to-offer ratio means, they become partners in fixing it rather than obstacles to process improvement.
Key takeaways
Hiring metrics work when they are defined consistently, reviewed at the right cadence, and connected to actual business outcomes rather than activity volume.
| Point | Details |
|---|---|
| Define before you track | Document each metric’s formula and share it with every hiring team member before collecting data. |
| Start with four core metrics | Time-to-fill, cost-per-hire, offer acceptance rate, and quality of hire provide the most reliable baseline insight. |
| Benchmarks require context | The 44-day average time-to-fill and $4,700 cost-per-hire are starting points, not universal targets. |
| Read metrics in combination | Rising time-to-fill with a stable interview ratio signals sourcing problems, not process failures. |
| Connect to post-hire outcomes | Quality of hire and first-year retention are the metrics that prove recruiting’s business value. |
Why most hiring teams are measuring the wrong things
After working with dozens of HR teams on recruitment analytics, the pattern I see most often is not a lack of data. It is an excess of the wrong data. Teams spend hours building dashboards full of activity metrics that feel like accountability but produce no insight. The number of job posts published this week, the volume of resumes screened, the count of recruiter calls made. None of those numbers tell you whether you are hiring well.
The shift that changes everything is moving from measuring what your team did to measuring what your team achieved. That means tracking hiring performance indicators like quality of hire and offer acceptance rate even when they are harder to calculate. It means connecting your ATS data to your performance management system so you can see whether the candidates you selected are actually succeeding in the role.
I also think the industry underestimates how much market conditions should influence metric interpretation. A team that maintained a 42-day time-to-fill during a talent shortage is performing better than a team that hit 30 days in a buyer’s market. Context is not an excuse. It is part of the analysis.
The future of recruitment analytics will involve AI-assisted pattern recognition across large candidate datasets, and platforms are already moving in that direction. But the fundamentals will not change. Garbage in, garbage out. If your definitions are inconsistent and your post-hire data is missing, no algorithm will save your reporting.
— Pavel
See how Testask improves your hiring metrics in practice
Testask is an AI-powered recruitment assessment platform built to help HR teams and hiring managers make faster, more confident decisions at every stage of the funnel. It automates candidate evaluation, generates tailored skill assessments, and surfaces the data you need to track quality of hire from the screening stage forward. Instead of manually compiling pipeline data across spreadsheets and email threads, your team gets a centralized view of candidate performance that feeds directly into your metrics framework. If you are ready to move from activity tracking to outcome measurement, explore Testask and see how AI-assisted analysis changes what your hiring data can tell you.
FAQ
What are hiring metrics?
Hiring metrics are quantitative measurements used to evaluate the efficiency, quality, and cost of a recruitment process. Core examples include time-to-fill, cost-per-hire, offer acceptance rate, and quality of hire.
What is a good time-to-fill benchmark?
The U.S. average time-to-fill is 44 days, a figure that has increased 24% since 2021. Benchmarks vary significantly by role type, seniority, and industry, so your own historical average is the most useful reference point.
How do you calculate cost-per-hire?
Cost-per-hire equals total recruiting spend divided by the number of hires in a given period. The average for non-executive roles is $4,700, while executive hires cost approximately seven times more.
Why is quality of hire so hard to measure?
Quality of hire requires connecting pre-hire screening data to post-hire performance ratings and retention data, which demands coordination across HR, hiring managers, and sometimes finance. Only 20% of organizations currently measure it despite near-universal agreement on its importance.
How often should hiring metrics be reviewed?
Pipeline metrics like interview-to-offer ratio should be reviewed weekly. Outcome and cost metrics like cost-per-hire and quality of hire are best reviewed monthly or quarterly to identify meaningful trends rather than short-term noise.
Recommended
- What Is Hiring Analytics? A Guide for HR Teams | Testask Blog | testask
- Harnessing data analytics to transform hiring decisions | Testask Blog | testask
- Top talent acquisition tips for smarter hiring in 2026 | Testask Blog | testask
- Hiring process best practices: proven steps for better talent | Testask Blog | testask