Multi-Rater Scoring: Methods, Models, and Reporting
Multi-Rater Scoring: Methods, Models, and Reporting

Multi-rater scoring collects ratings from multiple observers — managers, peers, direct reports, parents, teachers, or clinicians — and combines them into a single defensible estimate of a person’s performance, behavior, or ability. The core challenge is not aggregation; it is fairness. Raters differ systematically in how strictly or leniently they score, and ignoring that variation inflates or deflates individual scores in ways that have nothing to do with the person being rated.
The practical verdict: use simple averages or weighted composites for low-stakes developmental feedback when rater pools are small and the goal is reflection, not selection. Move to the Many-Facet Rasch Model (MFRM) or a trifactor/IRT approach when you need individual-level ability estimates corrected for rater severity, especially in high-stakes or clinical contexts.
Key trade-offs at a glance:
- Simplicity vs. fairness: Averages are transparent and easy to explain, but they treat every rater as equally calibrated.
- Precision vs. data requirements: MFRM and trifactor models correct for rater effects, but they need connected designs and adequate sample sizes.
- Interpretability vs. technical complexity: SEM and generalizability theory produce rich variance decompositions, but require psychometric expertise to implement and communicate.
- Development vs. selection: Developmental uses tolerate more measurement error; high-stakes decisions demand stricter validity evidence and invariance testing.
Key Takeaways
Multi-rater scoring produces defensible, fair estimates only when the scoring method matches the data structure, sample size, and decision stakes of the assessment.
| Point | Details |
|---|---|
| Match method to stakes | Use simple averages for developmental 360s; use MFRM or trifactor when individual-level fairness or high-stakes decisions are involved. |
| Connected design is non-negotiable | MFRM requires a connected rater network; run a connectivity check before fitting any model or releasing scores. |
| Diagnostics before reporting | Always inspect infit/outfit statistics, rater severity spread, and scalar invariance before comparing scores across rater groups. |
| FORT and FORS improve data quality | Frame-of-reference training and behavioral anchor scales reduce rater error and dimension overlap, as shown in Personnel Psychology research. |
| Testask supports the full workflow | Testask collects structured multi-rater ratings, keeps individual scores separate for anonymity, and exports model-ready data for MFRM or composite scoring. |
Table of Contents
- What is a multi-rater assessment and when should you use one?
- Simple scoring approaches: averages, weighted means, and composites
- Advanced psychometric approaches compared: MFRM, trifactor, SEM, and G-theory
- From raw ratings to published scores: a step-by-step implementation checklist
- Worked example: fitting a Many-Facet Rasch Model via a GLMM in R
- How to present a multi-perspective assessment report
- Improving rater accuracy: frame-of-reference training and design changes
- Validity, reliability, and limits: what to report and when not to use scores
- Practical tools, packages, and further reading
- What recent research tells practitioners about scoring method choice
- A practitioner’s perspective on implementing multi-rater scoring
- Testask makes multi-rater assessment workflows faster and more consistent
- Sources
What is a multi-rater assessment and when should you use one?
A multi-rater assessment, also called a multi-informant or 360-degree assessment, gathers structured ratings from two or more observers who interact with the person being assessed in different roles or contexts. The rationale is straightforward: no single observer sees the full picture. A manager observes strategic behavior; peers observe collaboration; direct reports observe day-to-day leadership. In clinical settings, parents, teachers, and clinicians each contribute a different observational window on a child’s behavior.
The distinction between developmental and high-stakes use is not just procedural — it changes every methodological decision you make.
In the U.S., 360-degree feedback is primarily used as a developmental tool, with results kept confidential between the participant and a coach to protect rater anonymity and encourage candor. When the same data feeds a promotion or termination decision, the ethical and psychometric bar rises substantially: you need documented validity evidence, measurement invariance across rater groups, and a clear policy on how scores are used.
The Conners 4 (Conners Multi-Rater report) is a well-known clinical example. It collects ratings from parents, teachers, and the child across the same symptom domains, then presents a multi-perspective report that flags discrepancies between informants rather than simply averaging them. That design choice reflects a deliberate clinical judgment: context-specific variance is meaningful, not noise to be averaged away.
| Use case | Primary purpose | Confidentiality | Anonymity needed | Measurement invariance required |
|---|---|---|---|---|
| Developmental 360 | Reflection and growth | High — participant only | Yes, to encourage candor | Preferred but not always required |
| Performance review | Evaluation input | Moderate — HR and manager | Recommended | Required if scores inform decisions |
| Clinical assessment | Diagnosis or monitoring | Strict — HIPAA applies | Varies by informant type | Required for cross-informant comparisons |
| Selection / high-stakes | Hiring or promotion | Strict — legal exposure | Yes | Required |
Simple scoring approaches: averages, weighted means, and composites
For many developmental applications, simple methods work well enough. The three most common are the arithmetic mean, the weighted mean, and a summed composite.
Arithmetic mean across raters for a single item:
Mean = (R₁ + R₂ + R₃) / n
where R₁, R₂, R₃ are the ratings from each rater and n is the number of raters.
Weighted mean assigns differential weight to rater groups (for example, giving manager ratings twice the weight of peer ratings):
Weighted Mean = (w₁R₁ + w₂R₂ + w₃R₃) / (w₁ + w₂ + w₃)
Summed composite adds item scores within a rater group and then averages across groups, which is common in structured scorecards and candidate scoring rubrics.
A short numeric example
Three raters score a candidate on one item using a 1–5 scale: Rater A gives 4, Rater B gives 2, Rater C gives 5. The arithmetic mean is (4 + 2 + 5) / 3 = 3.67. If Rater A is the direct supervisor and you assign weights of 2, 1, 1 respectively, the weighted mean is (8 + 2 + 5) / 4 = 3.75. A modest difference here, but when Rater B is a known harsh scorer and the item is high-stakes, that uncorrected 2 can meaningfully depress a person’s final score.
Simple methods are appropriate when:
- The assessment is purely developmental and scores will not drive formal decisions.
- The rater pool is small (fewer than five raters per person) and raters share a common context.
- You lack the sample size to fit a psychometric model reliably.
- Transparency and stakeholder buy-in matter more than precision.
Their core limitation is that they treat all raters as interchangeable. A lenient rater who consistently gives 5s and a harsh rater who consistently gives 2s produce the same average contribution, even though their scores carry very different calibration. For handling missing ratings, the safest approach is to compute the mean over available raters rather than imputing zeros, and to flag any person rated by fewer than three raters as having insufficient coverage.
Pro Tip: When using a candidate scoring rubric with multiple evaluators, always record each rater’s scores separately before aggregating. Averaging at the item level before combining across raters preserves more information and makes rater-effect diagnostics possible later.
Advanced psychometric approaches compared: MFRM, trifactor, SEM, and G-theory
When developmental stakes rise or individual-level fairness matters, four psychometric frameworks are worth knowing. Each solves a different version of the rater-effect problem.
Many-Facet Rasch Model (MFRM)
MFRM places persons, items, and raters on a common logit scale so that person ability, item difficulty, and rater severity are directly comparable. The core logit equation for a three-facet model is:
log(P_nij / P_nij-1) = θ_n − δ_i − τ_j
where θ_n is person ability, δ_i is item difficulty, and τ_j is rater severity. A positive τ_j means the rater is harsher than average; a negative τ_j means more lenient. The model corrects person estimates for these rater effects, producing fairer individual scores. It handles sparse connected designs — meaning not every rater needs to rate every person, as long as the network of shared ratings links all facets together. Stable estimates typically require 30 or more persons, 4 or more items, and 3 or more raters with multiple ratings per cell.
The canonical software is Facets (Linacre), a dedicated MFRM program that produces Wright maps, rater severity tables, and fit statistics in a single output. R users can approximate MFRM estimates using lme4::glmer, with crossed random effects for persons, items, and raters.
Trifactor model (Bauer et al., 2013)
The trifactor model decomposes item responses into a common factor, a rater-specific factor, and item-specific variance, producing person scores that are purged of idiosyncratic rater variance. It is particularly useful when raters come from non-exchangeable contexts — for example, a manager rating leadership and a peer rating collaboration — because it models each rater group’s unique perspective explicitly rather than treating it as error.
Performance depends heavily on sample size, the number of items shared across rater groups, and whether invariance constraints hold. Simulation work shows poorer factor recovery when items are not invariant or when shared items are few. The trifactor is implemented in R via lavaan or Mplus.
SEM and MTMM approaches
Structural equation modeling (SEM) with a multitrait-multimethod (MTMM) structure decomposes variance into trait, method (rater group), and error components. It answers the question: how much of the score variance is attributable to the person vs. the rater group vs. random error? When multisource assessment is used for development, scalar invariance is a prerequisite for valid mean comparisons across rater groups. SEM is implemented in lavaan ® or Mplus.
Generalizability theory (G-theory)
G-theory partitions score variance into person, rater, item, and interaction components using a variance-components framework. It produces G-coefficients (analogous to reliability coefficients) that tell you how much of the observed score variance is attributable to the person rather than rater or item differences. G-theory is well-suited to study design questions: how many raters or items do you need to reach a target reliability? The gtheory package in R handles most common designs.
| Dimension | MFRM | Trifactor | SEM/MTMM | G-theory |
|---|---|---|---|---|
| Best use case | High-stakes scoring, rater correction | Non-exchangeable rater groups | Variance decomposition, construct validity | Design optimization, reliability planning |
| Adjusts for rater severity | Yes, explicitly | Yes, via rater factor | Partially (method variance) | No direct correction |
| Data requirements | Connected design, 30+ persons | Large N, shared items across groups | Large N, multiple traits and methods | Balanced or near-balanced designs |
| Technical complexity | Moderate (Facets or glmer) | High (lavaan/Mplus) | High (lavaan/Mplus) | Moderate (gtheory R package) |
| Output type | Person ability estimates on logit scale | Purged latent scores | Latent factor scores, fit indices | Variance components, G-coefficients |
| Software | Facets (Linacre), lme4 in R | lavaan, Mplus | lavaan, Mplus | gtheory ® |
When to prefer which:
- MFRM: You need individual-level ability estimates corrected for rater severity, and your design is connected. Clinical scoring, structured interviews, rubric-based performance assessment.
- Trifactor: Rater groups are meaningfully different (managers vs. peers vs. direct reports) and you want scores that reflect only the common construct, not rater-group perspective.
- SEM/MTMM: Your primary question is construct validity — does the instrument measure what it claims across rater groups?
- G-theory: You are designing a study and need to know the optimal number of raters and items before collecting data.
From raw ratings to published scores: a step-by-step implementation checklist
Getting from a spreadsheet of raw ratings to a defensible published score requires more than running a model. Data preparation and diagnostic checks account for most of the work.
- Structure your data in long format. Each row should represent one rating: columns for person ID, item ID, rater ID, rater group (manager/peer/direct report), and the numeric rating. Never aggregate before modeling.
- Verify identifiers are consistent. A person coded “JSmith” in one file and “J. Smith” in another creates phantom disconnections in the rater network.
- Check for shared items and raters. MFRM requires a connected design: every person must be reachable from every other person through a chain of shared raters or shared items. Run a connectivity check before fitting any model.
- Apply sample-size heuristics. For MFRM, target 30 or more persons, 4 or more items, and 3 or more raters. For trifactor, larger samples (100+) are needed for stable factor recovery, especially when shared items across rater groups are few.
- Inspect missing data patterns. Missing completely at random (MCAR) is manageable; systematic missingness (e.g., a rater group that skipped all difficult items) can bias estimates. Flag and investigate before proceeding.
- Fit the model and inspect fit statistics. For MFRM, check infit and outfit mean-square statistics; values between 0.6 and 1.4 indicate acceptable fit. For SEM/trifactor, inspect CFI, RMSEA, and SRMR.
- Check rater severity estimates. Plot rater severity on the logit scale. Raters more than 2 logits from the mean warrant investigation: did they misunderstand the scale, or are they genuinely calibrated differently?
- Produce person-level estimates and confidence intervals. Report the standard error for each person estimate, not just the point estimate.
- Document all decisions. Which model was fit, why, what diagnostics were checked, and what thresholds were used for flagging misfitting raters.
- Review outputs with a subject-matter expert before releasing scores. A psychometrician can catch model issues; a domain expert catches substantive anomalies.
Model selection quick rules:
- Small developmental cohort, no high-stakes decisions → simple averages with a structured candidate scoring rubric.
- Individual-level ability estimates needed, rater correction required → MFRM via Facets or
lme4::glmer. - Non-exchangeable rater groups, want purged scores → trifactor via
lavaan. - Construct validity question, large N → SEM/MTMM.
- Design optimization before data collection → G-theory.
Pro Tip: A common pragmatic approach is to pilot with averages and rubrics in the first wave, then move to MFRM once connectedness and data volume are confirmed. This reduces upfront resource costs while preserving the option to upgrade the model.
Worked example: fitting a Many-Facet Rasch Model via a GLMM in R
The MFRM can be approximated using a generalized linear mixed model (GLMM) with crossed random effects. Here is a minimal reproducible example using lme4.
Data layout
A minimal dataset looks like this (8 rows shown):
| person_id | item_id | rater_id | rater_group | rating |
|---|---|---|---|---|
| P01 | I1 | R_A | manager | 4 |
| P01 | I2 | R_A | manager | 3 |
| P01 | I1 | R_B | peer | 5 |
| — | I1 | R_A | manager | 2 |
| — | I2 | R_C | peer | 3 |
| — | I1 | R_B | peer | 4 |
| — | I2 | R_C | peer | 4 |
| — | I1 | R_A | manager | 3 |
R pseudocode
library(lme4)

# Fit crossed random effects model
# person = ability (theta), item = difficulty (delta), rater = severity (tau)
model <- glmer(
  rating ~ (1 | person_id) + (1 | item_id) + (1 | rater_id),
  data   = ratings_long,
  family = poisson(link = "log")   # or gaussian for Likert data
)

# Extract random effects
re <- ranef(model)

# Person ability estimates (higher = more able)
person_estimates <- re$person_id

# Rater severity: positive RE = lenient; flip the sign for MFRM convention
# In MFRM, positive tau = harsh; lme4 RE sign is opposite
rater_severity <- -re$rater_id

# Compute separation reliability for persons
person_var   <- as.numeric(VarCorr(model)$person_id)
residual_var <- sigma(model)^2
separation_reliability <- person_var / (person_var + residual_var)
The sign flip on rater random effects is critical: lme4 encodes a high random effect as “this rater gives higher ratings than average” (leniency), while MFRM convention encodes a high τ_j as severity. Always flip the sign when translating between the two frameworks.
Diagnostics and visuals
- Wright map: Plot person ability estimates (left column) against item difficulty estimates (right column) on the same logit scale. Persons clustered above the item difficulty range are not being challenged; persons below it are struggling with most items.
- Rater severity chart: A dot plot of τ_j estimates with 95% confidence intervals. Raters whose intervals do not overlap with the mean warrant a calibration conversation.
- Person histogram: Distribution of θ_n estimates. A bimodal distribution may indicate two distinct performance groups; extreme skew may indicate a ceiling or floor effect.
Interpreting a +1.0 logit rater severity
A rater with τ_j = +1.0 logit is approximately 1 logit harsher than the average rater. In practical terms, a person who would receive a rating of 3 out of 5 from an average rater would receive roughly a 2 from this rater, all else equal. When explaining this to stakeholders, a useful framing is: “Rater A’s scores have been adjusted upward by about one rating point to account for their consistently stricter standard, so the final score reflects the person’s actual performance rather than Rater A’s calibration.”
How to present a multi-perspective assessment report
A well-structured report translates model outputs into findings that non-technical stakeholders can act on. The recommended structure has six components.
1. Executive summary (1 page): State the purpose, the number of persons and raters, the scoring method used, and the top three findings. Avoid model jargon here.
2. Methods section: Describe the instrument, rater groups, data collection period, and the scoring model. State the sample-size thresholds met and the fit criteria used.
3. Rater overview: Present a rater severity chart with confidence intervals. Flag any raters whose severity estimates are more than 2 logits from the mean and note whether their scores were adjusted.
4. Person-level findings: For each person (or anonymized group), report the ability estimate, standard error, and a plain-language interpretation. Include a comparison to the group mean on the logit scale.
5. Development suggestions: Map person estimates to behavioral anchors on the Wright map. A person whose estimate falls below item I3 (“delegates effectively”) has a concrete development target.
6. Appendix: Include data coverage (number of ratings per person, missing data rates), model fit statistics (infit/outfit, CFI/RMSEA where applicable), and a note on confidentiality procedures.
Essential visuals to include:
- Wright map showing person and item distributions on the same scale.
- Rater severity chart with confidence intervals.
- Item difficulty table sorted from easiest to hardest, with mean ratings per rater group.
- Rater-group mean profiles with 95% confidence intervals, but only after confirming scalar invariance across groups.
For non-technical audiences, avoid phrases like “logit scale” or “random effects.” Instead, write: “Scores have been adjusted to account for differences in how strictly each rater tends to score, so comparisons across rater groups are fair.” For confidentiality, include a one-sentence statement in the report header: “Individual rater responses are not disclosed; only aggregated and adjusted scores are reported.”
For teams building structured scorecards across multiple evaluators, the same report structure applies: document rater calibration, present adjusted scores, and keep raw rater data in a restricted appendix.
Improving rater accuracy: frame-of-reference training and design changes

The best scoring model cannot fix poor-quality ratings. Rater training and instrument design are the upstream interventions that determine how much signal your data actually contains.
Frame-of-reference training (FORT) teaches raters what each performance dimension means, what good and poor performance looks like behaviorally, and how to use the rating scale consistently. A typical FORT session runs 60–90 minutes and includes: a definition of each dimension, video or written vignettes illustrating high/medium/low performance, a practice rating exercise, and group calibration discussion.
Frame-of-reference scales (FORS) embed behavioral anchors directly into the rating scale, so raters see concrete examples at each scale point rather than abstract labels like “exceeds expectations.” Personnel Psychology research shows that FORS reduces dimension overlap and rating error compared with traditional scales, with controlled lab and field comparisons confirming the accuracy gains.
Research finding: Frame-of-reference training combined with concise, customized surveys per rater group increases data quality and reduces measurement error in multisource feedback applications. Field and lab studies in Personnel Psychology show FORS reduces dimension overlap and error relative to traditional scales, with accuracy gains observed across both lab and field conditions.
Design recommendations for reducing rater bias:
- Keep surveys short and customized per rater group. A manager survey and a peer survey should share core items but include role-specific items relevant to what each group actually observes.
- Use structured rating guides with behavioral anchors at each scale point. Vague anchors (“sometimes demonstrates”) produce more rater variance than specific behavioral descriptions.
- Run a calibration exercise before live scoring: have all raters score the same practice vignette, then discuss discrepancies as a group.
- Schedule FORT close to the rating period, not weeks in advance. Accuracy gains decay with time.
Operational checklist for a rater training program:
- Distribute rating instructions and scale definitions at least one week before the rating window opens.
- Hold a 60-minute FORT session (live or recorded) covering dimension definitions, vignettes, and practice ratings.
- Provide a one-page quick reference card with behavioral anchors for each scale point.
- Send a reminder email 48 hours before the rating deadline with the quick reference card attached.
- After data collection, run a rater severity check and flag raters whose estimates are outliers for a brief calibration follow-up.
Validity, reliability, and limits: what to report and when not to use scores
Reporting a score without its measurement quality indicators is incomplete. These are the indices practitioners must include in any multi-rater assessment report.
Intraclass correlation coefficient (ICC): Measures agreement among raters. ICC(2,k) is appropriate when raters are treated as a random sample from a larger pool. Values above 0.70 indicate acceptable inter-rater reliability for most developmental uses; high-stakes decisions warrant 0.80 or higher.
Facet separation reliability (MFRM): Analogous to Cronbach’s alpha for the person facet. It estimates the ratio of true variance to observed variance across persons. Values above 0.80 indicate the model can reliably distinguish persons from one another.
G-coefficients: From generalizability theory, the G-coefficient estimates the proportion of score variance attributable to persons rather than raters, items, or their interactions.
Model fit statistics: For MFRM, report infit and outfit mean-square values for persons, items, and raters. For SEM/trifactor, report CFI (target ≥ 0.95), RMSEA (target ≤ 0.06), and SRMR (target ≤ 0.08).
Scalar invariance: Before comparing mean scores across rater groups (e.g., manager means vs. peer means), test for scalar invariance using a configural → metric → scalar invariance sequence in a CFA framework. Scalar invariance is required if you intend to compare means across rater groups; without it, mean differences may reflect scale use differences rather than real performance differences.
Ethical and confidentiality considerations in the U.S.:
- In developmental 360 programs, individual rater responses should never be disclosed to the ratee or their manager. Aggregate and adjust before sharing.
- In clinical settings, HIPAA governs data handling. Multi-rater clinical reports (such as Conners 4 multi-rater outputs) must be stored and transmitted under appropriate safeguards.
- When scores inform selection or promotion decisions, document the validity evidence, the scoring procedure, and the decision rules in writing before using scores.
When not to use multi-rater scores for high-stakes decisions: Sparse, disconnected rater networks produce unstable MFRM estimates. Fewer than three items per rater group makes factor recovery unreliable in trifactor models. Inconsistent behavioral anchors across rater groups invalidate cross-group comparisons. If any of these conditions apply, scores should be used for reflection only — not for formal decisions — until the design is corrected.
Red flags that disqualify high-stakes use:
- Fewer than 3 raters per person in a high-stakes context.
- Disconnected rater network (MFRM connectivity check fails).
- Scalar invariance tests rejected across rater groups.
- Infit or outfit mean-square values above 1.5 for more than 20% of items.
- Rating scale used inconsistently across rater groups (different anchors, different number of points).
Practical tools, packages, and further reading
Getting the right software in place before you start saves significant rework.
Facets (Linacre): The canonical MFRM software. Produces Wright maps, rater severity tables, fit statistics, and person ability estimates in a single run. Best choice when MFRM is your primary model and you want purpose-built output without custom coding.
R: lme4 package: Fits GLMM models that approximate MFRM via crossed random effects. Use glmer for ordinal or count data; lmer for continuous approximations. Free, reproducible, and integrates with the broader R ecosystem for visualization (ggplot2) and reporting (rmarkdown).
R: lavaan package: The standard R implementation for SEM, CFA, and trifactor models. Supports full invariance testing sequences (configural, metric, scalar) and produces fit indices compatible with reporting standards.
R: gtheory package: Implements generalizability theory variance decompositions. Use it for study design questions: how many raters and items do you need to reach a target G-coefficient?
R: mirt package: Fits multidimensional IRT models, including extensions to MFRM that relax equal-discrimination assumptions. Useful when item or rater heterogeneity is suspected and a standard MFRM fit is poor.
MetricGate MFRM Calculator: An online tool that implements MFRM and provides interactive output. Useful for quick demonstrations and for teams without R infrastructure.
Recommended reading:
- Linacre, J. M. (1989/2020). Many-Facet Rasch Measurement. MESA Press. The foundational text for MFRM theory and Facets software
- Bauer et al. (2013) — trifactor model: The primary simulation study establishing trifactor performance and its limits.
- Frontiers in Psychology (2018) — MSA for development: Methodological recommendations for scalar invariance and trait-context modeling.
- CCL (2026) — scoring method comparison: Large-sample empirical comparison of averaged vs. advanced latent models.
- Behaviormetrika / Springer — generalized MFRM: Extensions that relax equal-discrimination assumptions for heterogeneous rater pools.
For assessment tool examples relevant to HR multi-rater contexts, the Testask blog covers practical implementations across hiring and development use cases.
What recent research tells practitioners about scoring method choice
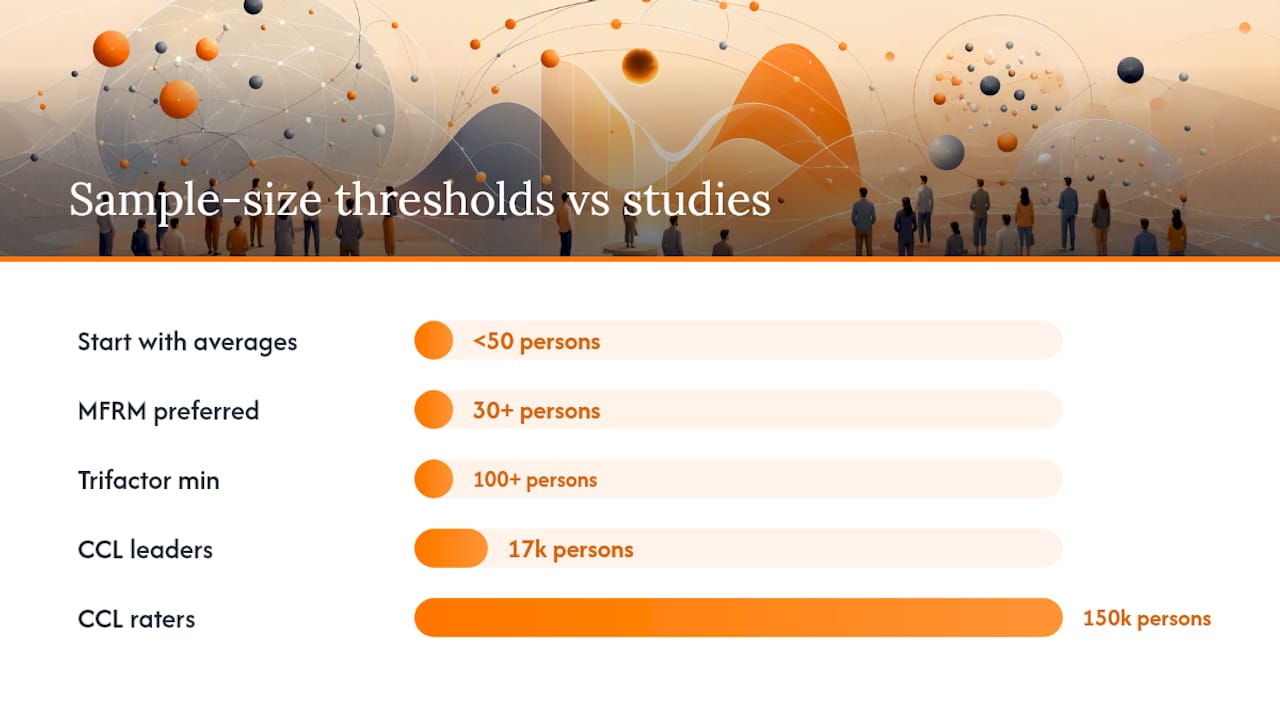
Three findings from recent studies are worth translating directly into practice.
Finding 1: Advanced models add incremental value, but not always enough to justify the cost. A CCL analysis across approximately 17,000 leaders and 150,000 raters found that averaged scoring methods and advanced latent approximation models overlap substantially. Advanced models do provide incremental predictive utility for leadership competency assessments, but the practical difference is modest for many developmental applications. The implication: do not default to MFRM just because it sounds more rigorous. Run a pilot with averages first, check whether rater severity variance is large enough to matter, and then decide whether the modeling investment is justified.
Practical implication from CCL’s data: When rater severity variance is small relative to person variance, simple averages and MFRM produce nearly identical rank orderings. The case for advanced modeling strengthens when rater severity spread is large, when individual-level fairness is legally or ethically critical, or when the assessment informs high-stakes decisions.
Finding 2: The trifactor model’s performance is conditional. Simulation results from Bauer et al. show that the trifactor recovers person scores well under favorable conditions — large samples, multiple shared items across rater groups, and invariant factor loadings. When those conditions are not met, the model can produce less accurate estimates than a well-specified SEM or even a weighted average. Before committing to the trifactor, verify that you have at least 100 persons, that rater groups share a meaningful number of items, and that a preliminary CFA supports loading invariance.
Finding 3: Diagnostics before decisions. The most common implementation failure is skipping the connectivity check and fit inspection and going straight to score reporting. A disconnected rater network produces MFRM estimates with inflated standard errors that look precise but are not. Run the connectivity check, inspect fit statistics, and review the rater severity chart before releasing any scores.
Recommendations for practice:
- For cohorts under 50 persons or purely developmental purposes, start with weighted averages and a structured skills assessment framework.
- For cohorts of 30 or more persons with a connected design and at least 4 items, MFRM via Facets or
lme4::glmeris the preferred approach when individual-level fairness matters. - Always run diagnostics: connectivity, fit statistics, and rater severity spread. Report them in the appendix.
A practitioner’s perspective on implementing multi-rater scoring
The gap between what the psychometrics literature recommends and what actually happens in organizations is wide. Most teams that come to multi-rater scoring for the first time underestimate the data preparation burden and overestimate the interpretability of model outputs. The first project almost always takes three times longer than planned, not because the models are hard to fit, but because the data arrives in wide format with inconsistent person IDs, missing rater group labels, and items that were not shared across rater groups.
The single most valuable thing you can do before fitting any model is to draw the rater network on paper. List every person, every rater, and every item they share. If you cannot trace a path from Person A to Person B through shared raters or shared items, your network is disconnected and MFRM will not give you trustworthy estimates. Catching this at the design stage costs nothing; catching it after data collection costs everything.
Cross-team coordination is the other consistent challenge. The psychometrician who fits the model and the HR business partner who presents the results to leadership are often working from different mental models of what the scores mean. Build a one-page translation document: what the logit scale is, what a rater severity adjustment means in plain English, and what the confidence interval around a person estimate implies for decision-making. That document will be referenced in every stakeholder meeting.
A pilot of 30–50 persons is enough to surface all three issues without committing to a full deployment.
Testask makes multi-rater assessment workflows faster and more consistent
Running a multi-rater assessment manually — coordinating rater invitations, collecting structured ratings, exporting clean long-format data, and managing collaborative review — absorbs hours that most HR teams do not have. Testask addresses exactly that operational gap.

The platform generates tailored assessment tasks, collects candidate or employee submissions in a structured format, and applies AI-assisted scoring that produces model-ready exports. Rater groups can collaborate on reviews through collaborative scorecards that keep individual ratings separate until aggregation, preserving the rater anonymity that developmental 360 programs require. For teams moving from pilot averages to MFRM, Testask’s export format maps directly to the long-format data structure the lme4::glmer workflow expects.
Before deploying any multi-rater assessment in the U.S., review your privacy and confidentiality settings: developmental results should be accessible only to the participant and their coach, and any data used for selection decisions requires documented validity evidence. Testask’s permission controls support both configurations. Start a free trial at Testask to see how the platform fits your assessment workflow.
Sources
- Evaluating assessment scoring method (Center for Creative Leadership, 2026)
- Examining the Performance of the Trifactor Model for Multiple Raters - PMC
- Multisource assessment for development purposes: Revisiting the methodology of data analysis (Frontiers in Psychology)
This article is general information, not a substitute for advice from a qualified doctor. Consult a qualified healthcare professional about your own circumstances before acting on anything here.